In this episode, we debate whether the economy was in a recession this past year. We first define what a recession is according to traditional economic textbooks, but then most of our chat will focus on our thoughts on whether we believe there was a recession based on various economic indicators and our own analysis. It is important to have a clear understanding of what a recession is and to be able to recognize the signs of one in order to make informed decisions about our own finances and the economy as a whole. We hope that by the end, you will have a better understanding of this complex topic and be able to form your own opinion on the matter.
In this episode, we chat about the following topics:
What is the textbook definition of a recession?
Whether we each believe the economy was in a recession last year
The Phillip’s Curve and whether it’s still important to teach students
Pop culture economics examples related to unemployment
Matt highlights Right Hand Man, where Hamilton is unemployed
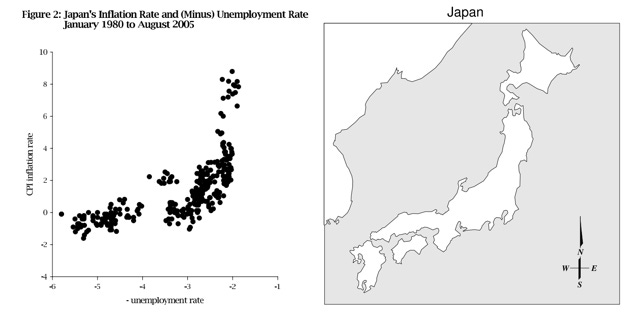
Jadrian highlights how Japan’s Phillip’s Curve looks like Japan
Watch Episode #3 on YouTube:
Some Show Notes:
While this episode is coming out in January, it wasn’t officially January when we recorded this one. As you might recall from Episode 2, Matt is participating in Dry January for his New Year’s Resolution this year. Matt recorded from his office on campus this time around, which means he stuck with a non-alcoholic choice of Great Value Diet Twist Up. Jadrian went a Chloe, a cranberry orange sour ale, from Starr Hill Brewery.
Both Matt and Jadrian are big fans of Untappd, a social media beer-drinking app that has gamified drinking. Even though we’ve been using it for a few years now, we only became Untappd friends last year. If you’re a big fan of data and beer, this is a good app for you. Jadrian is also a fan of Yelp!, Goodreads, and just about any other tracking app.
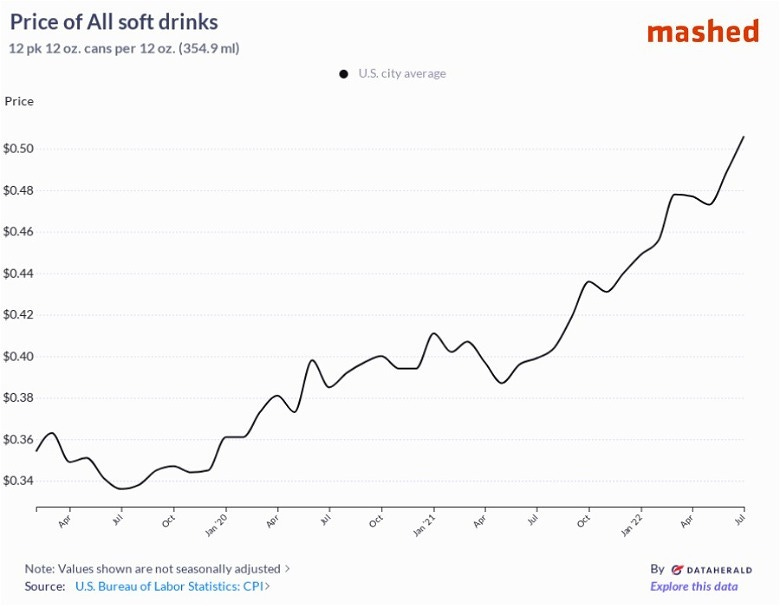
Even though the theme of the episode was recessions, we also touched on inflation for a bit. Matt commented on the increasing price of sodas, and how his family has definitely seen the effects. Jadrian hasn’t noticed, but Matt’s family drinks way more soda. Thanks to Mashed, we can actually see just how much soda prices have increased over the past few years.
The interesting part of defining recessions is that there is no official metric of a recession. The National Bureau of Economic Research is the organization tasked with tracking and determining the dates of recessions. The most commonly cited definition is really more of a guideline: two consecutive quarters of negative growth. In the US for the past 50 years, every time there have been two consecutive quarters of negative GDP growth, it has been characterized as a recession.
The NBER’s official stance is that “a recession involves a significant decline in economic activity that is spread across the economy and lasts more than a few months.” What’s interesting about all this is that the 2020 recession didn’t last two consecutive quarters, but was labeled a recession. In 2022, the US economy saw two consecutive quarters of negative growth, but it wasn’t marked as a recession. Why?
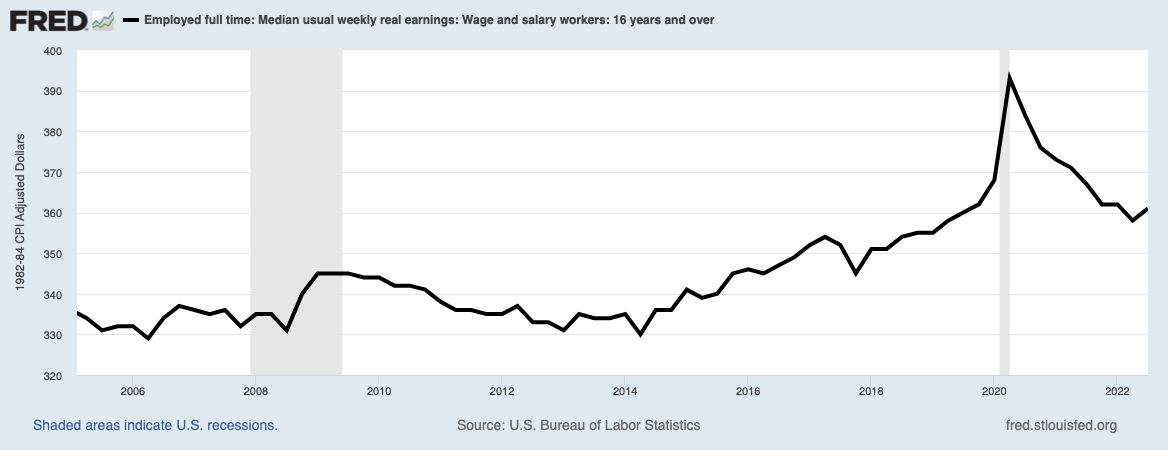
Typically these downturns are marked by higher levels of unemployment. This past year has been so strange because we have seen GDP drop but incredibly low unemployment. Instead, real wages are down about 3% for the average worker.
The last recession in the US was in 2020, where we saw a massive drop in output at the start of the pandemic. Matt and Jadrian then debate whether real wages are enough of a measure to determine recessions. They’re down a bit since the pandemic recession but generally rise.
High inflation with low unemployment brings us to the next discussion in our podcast. Two key economic indicators, unemployment and inflation, sometimes move in opposite directions in the short run. That isn’t always true, as we saw with Stagflation in the 1970s, but this view was common enough that it became a popular model known as the Phillips Curve. This tradeoff between unemployment and inflation is interesting on an additional level since part of the Federal Reserve’s dual mandate is to maintain stable prices and low unemployment.
This Week’s Pop Culture References
Jadrian’s choice for his pop culture reference this week was more of a "pop culture for economists.” Gregor Smith plotted data on Japan’s unemployment rate and inflation rates over the past 15 years and noticed an odd result. Japan’s Phillips Curve looks like Japan:
Matt highlights a great song from Hamilton that illustrates frictional unemployment. Multiple people tried to get Alexander Hamilton to work for them, but he opts to remain unemployed until the right opportunity comes up.
Like, Share, and Comment!
Enjoyed today’s episode? Share it with your friends! Economics Happy Hour is a free podcast and this post is freely available to readers. Share away! We would also love to hear from you so leave a comment! If there are topics you want us to talk about, please let us know.









Share this post